
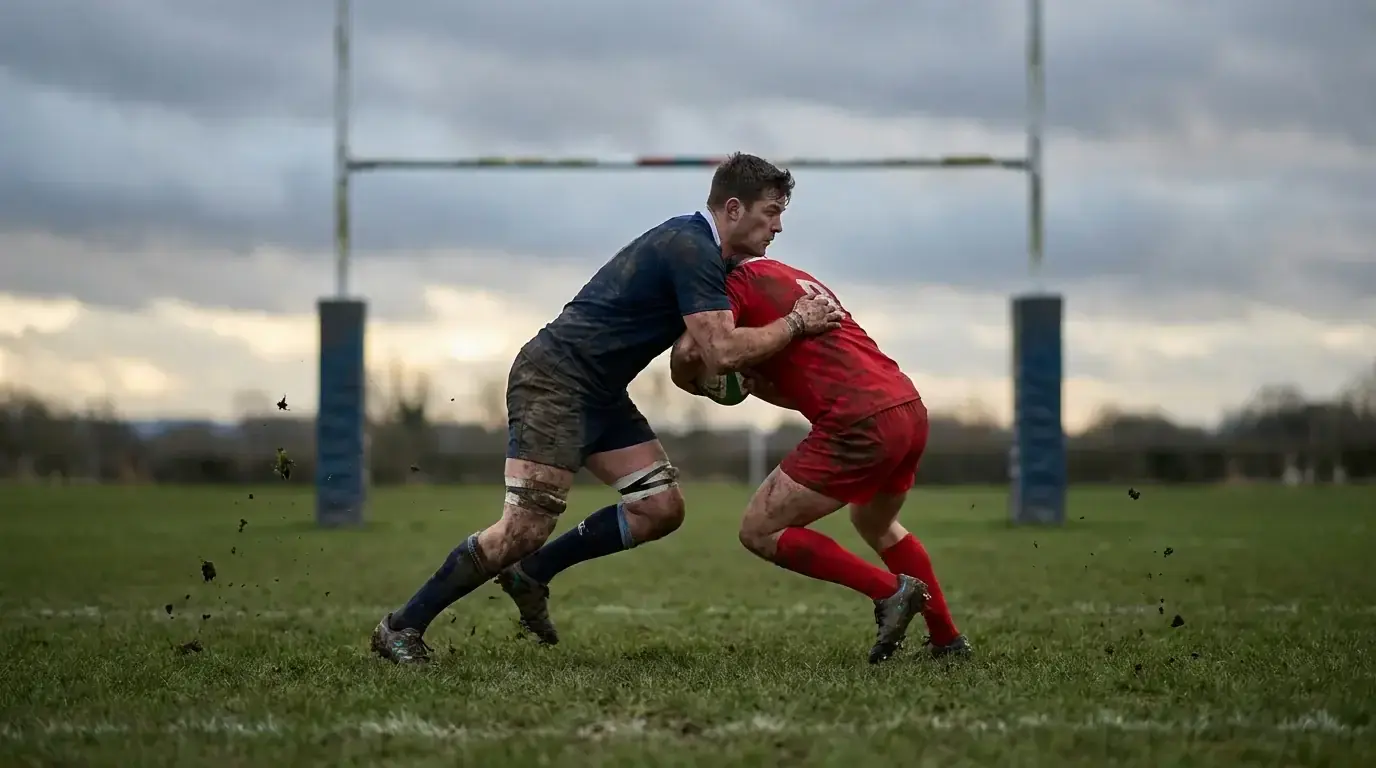

A punter once told me he never bets player props because “you can’t predict a number.” I asked him how many tackles a starting openside flanker makes in a tight international, and he answered within five of the real figure without thinking. He could predict the number; he just did not realise he could. Player props reward exactly that kind of positional instinct, dressed up with data, and they are the fastest-growing corner of the rugby coupon for good reason.
These markets price a player’s individual statistical output, tackles made, carries, metres gained, rather than the match result or who scores. They migrated into rugby from the data-saturated world of American sports, and they suit the modern game perfectly because rugby is now measured in granular detail. Understanding how the lines are set, which numbers are predictable and which are noise, turns props from an intimidating wall of figures into one of the more analysable markets available to a UK punter.
What player props actually measure
A player prop is a bet on a single performer’s statistical total, set as a line you bet over or under, much like a team total but applied to one individual. Instead of asking who wins, it asks how a specific player will perform on a specific metric.
The bookmaker posts a number, say 12.5 tackles for a back-row forward, and you bet whether the player finishes above or below it. The half-point removes the push, so the bet is cleanly two-way, and the odds on each side typically sit near even money with the operator’s margin built in. The metrics on offer have expanded as rugby’s data coverage has deepened: tackles made, carries, metres gained, line breaks, offloads, and kicking points for the goal-kickers all appear on the bigger fixtures. Around 60% of all rugby bets still land on match outcome and margin, which tells you props remain a specialist’s market rather than the casual punter’s default, and that relative obscurity is part of their appeal.
The reason props work as a betting product is that individual rugby output is more predictable than it first appears. A player’s role within the team shapes their statistics tightly: a defensive workhorse will rack up tackles, a ball-carrying number eight will pile up carries and metres, a goal-kicker accumulates points through the boot. Those roles are stable from match to match, which means a player’s historical averages, adjusted for the opponent and the expected game pattern, give a genuine basis for judging whether a posted line is too high or too low. Props are not random number-guessing; they are role-reading with a statistical overlay, and that is a skill a knowledgeable rugby watcher already half-possesses.
The main prop markets in detail
Each prop type rewards a different kind of insight, and knowing what drives each metric is the foundation of betting them well. The headline markets, tackles, carries and metres, behave quite differently from one another.
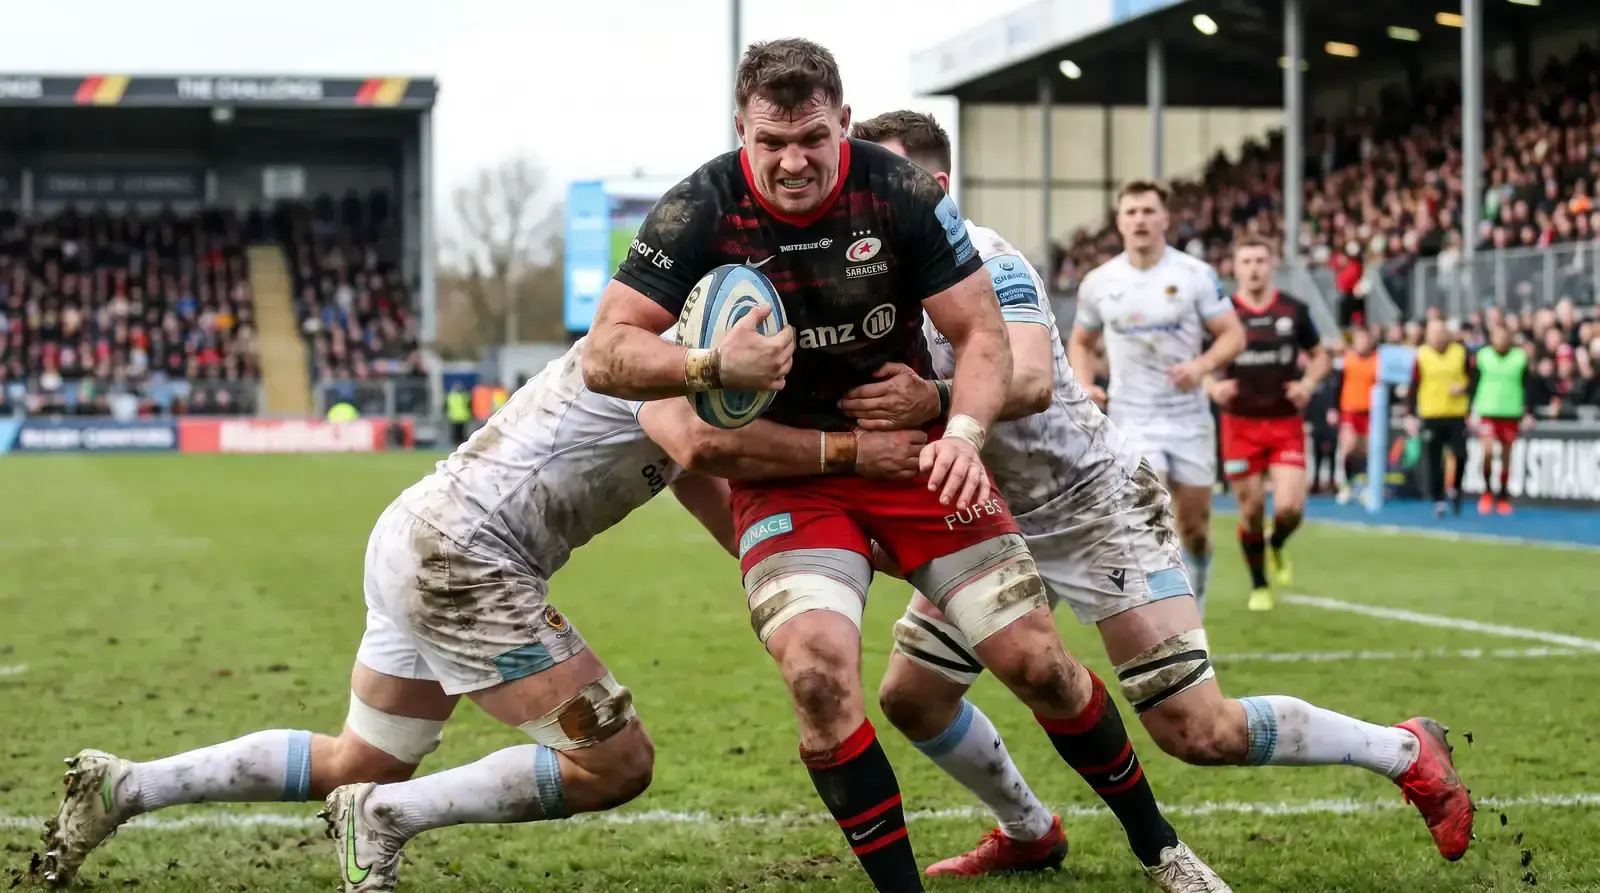
Tackles are the most stable and the most defensively driven. The players who top tackle counts are the forwards and defensive midfielders who occupy the middle of the field where most contact happens, particularly back-rowers and inside centres. A tackle line is really a forecast of how much defending a player’s team will do, which means it rises when the team is expected to be under pressure and lacks possession, and falls when the team dominates the ball. Betting tackle overs on a defensive grafter whose side is expected to spend the game defending is one of the more readable prop plays. Carries measure how often a player runs with the ball, dominated by the forward ball-carriers and the attacking backs, and a carry line tracks a player’s involvement in their team’s attacking shape. Metres gained is the most volatile, because it depends not just on how often a player carries but on how far they get, which introduces the randomness of line breaks and broken-field running that even a strong carrier cannot guarantee.
That volatility hierarchy matters for staking. Rugby generated around $8.26 billion in betting turnover in 2025, roughly 5% of the global sports betting market, and props are claiming a growing share of that as data coverage improves and punters grow comfortable with the markets. I lean towards the more stable metrics, tackles and carries, where role reliably drives the number, and treat metres-gained props with more caution because a single intercept or kick return can blow a line apart. The art is matching the metric’s predictability to my confidence: a high-conviction read deserves the more volatile, better-paying metres market, while a routine edge belongs in the steadier tackle and carry lines where role does the heavy lifting.
Turning data into a prop edge
Props are the one rugby market where doing genuine research with numbers gives a clear, repeatable advantage, because the lines are built from data and beaten with data. The punters who profit here treat it like a small modelling exercise rather than a hunch.

The starting point is a player’s recent averages on the metric in question, but raw averages mislead without context. I adjust for three things. First, the opponent: a tackle line against a possession-hungry attacking side is very different from the same line against a team that kicks for territory and hands back the ball. Second, the expected game pattern: a player on a side likely to be defending for long spells will see inflated tackle numbers and suppressed carries, and the reverse for a side expected to dominate possession. Third, the player’s specific role in the planned XV, because a positional shift, a flanker moved to number eight, a winger asked to come looking for work, changes their statistical profile from their historical baseline.

Where the data comes from matters too. The lines bookmakers post are built from the same performance-analysis feeds that the clubs and broadcasters use, and a punter can access much of the underlying statistical history through publicly available match data and analysis sites. The edge is not having secret numbers; it is interpreting the public ones better than the line implies, by weighting the matchup and game pattern the bookmaker may have treated generically. I build a quick expected range for the metric, compare it to the posted line, and bet only when the gap is meaningful, because a prop priced near my own estimate is just a coin flip against the margin. Props reward the punter who reads the game through the lens of role and matchup, then checks that reading against the numbers before staking. For the scoring-event side of individual betting, my guide to how the rugby try scorer market works covers betting on the touchdown itself rather than the statistics.
Matching props to the positions
The single most useful filter for prop betting is position, because a player’s role on the field dictates which metrics they will dominate and which they will barely register. Get the position-to-metric mapping right and half the analysis is already done.
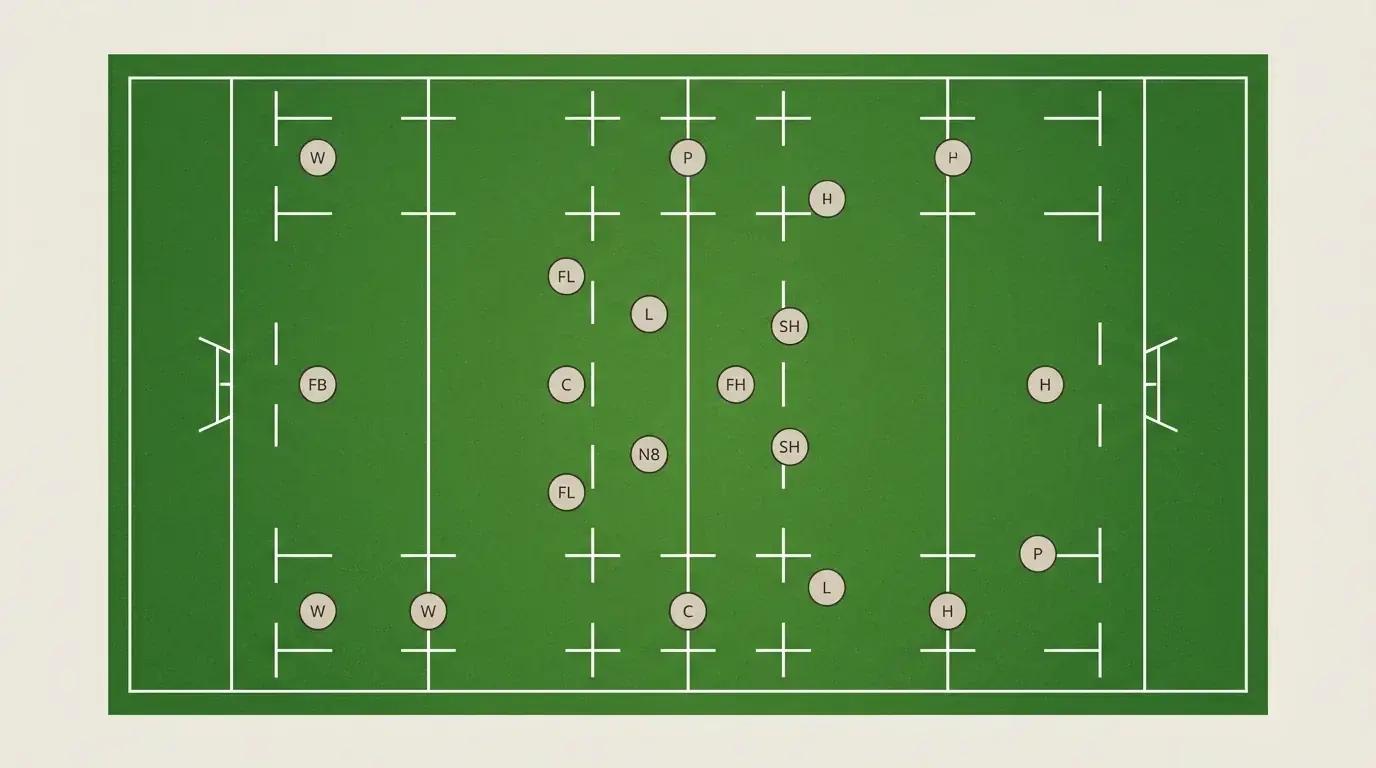
The back-row forwards, flankers and the number eight, are the engine of the prop market. They top tackle counts through their defensive workload and rack up carries through their close-range ball-carrying, which makes them the natural home for both tackle and carry props. The number eight in particular suits carry and metres markets, because the role is built around taking the ball forward from the base of the scrum and breakdown. Inside backs, the scrum-half and fly-half, generate kicking and passing involvement rather than carrying volume, so they appear more in kicking-points and pass-based props than in metres markets. The outside backs, wingers and full-backs, are the metres-and-line-breaks specialists, because their job is to run in space where big gains and broken-field running happen, making them volatile but high-ceiling picks for metres props.
The tight forwards, props and locks, are the props market’s quiet defensive contributors: heavy tackle and ruck involvement, modest carries, almost no metres. Mapping each metric to the positions that drive it is the foundation, but the real skill is spotting when a game plan pulls a player out of their positional norm, a lock asked to carry more in a ball-retention strategy, a winger instructed to roam infield looking for work. Those tactical shifts create the value, because the bookmaker often prices a player on their positional default while the coaches have planned something different. Read the position first, then the specific role the team intends for that player on the day, and the prop market stops being a wall of numbers and becomes a series of answerable questions.
